earth
Explore live wind, weather, oceans, and pollution on a moving globe.
Save to collection
Choose a home for earth.
Start your first collection below.
Why it’s worth your time
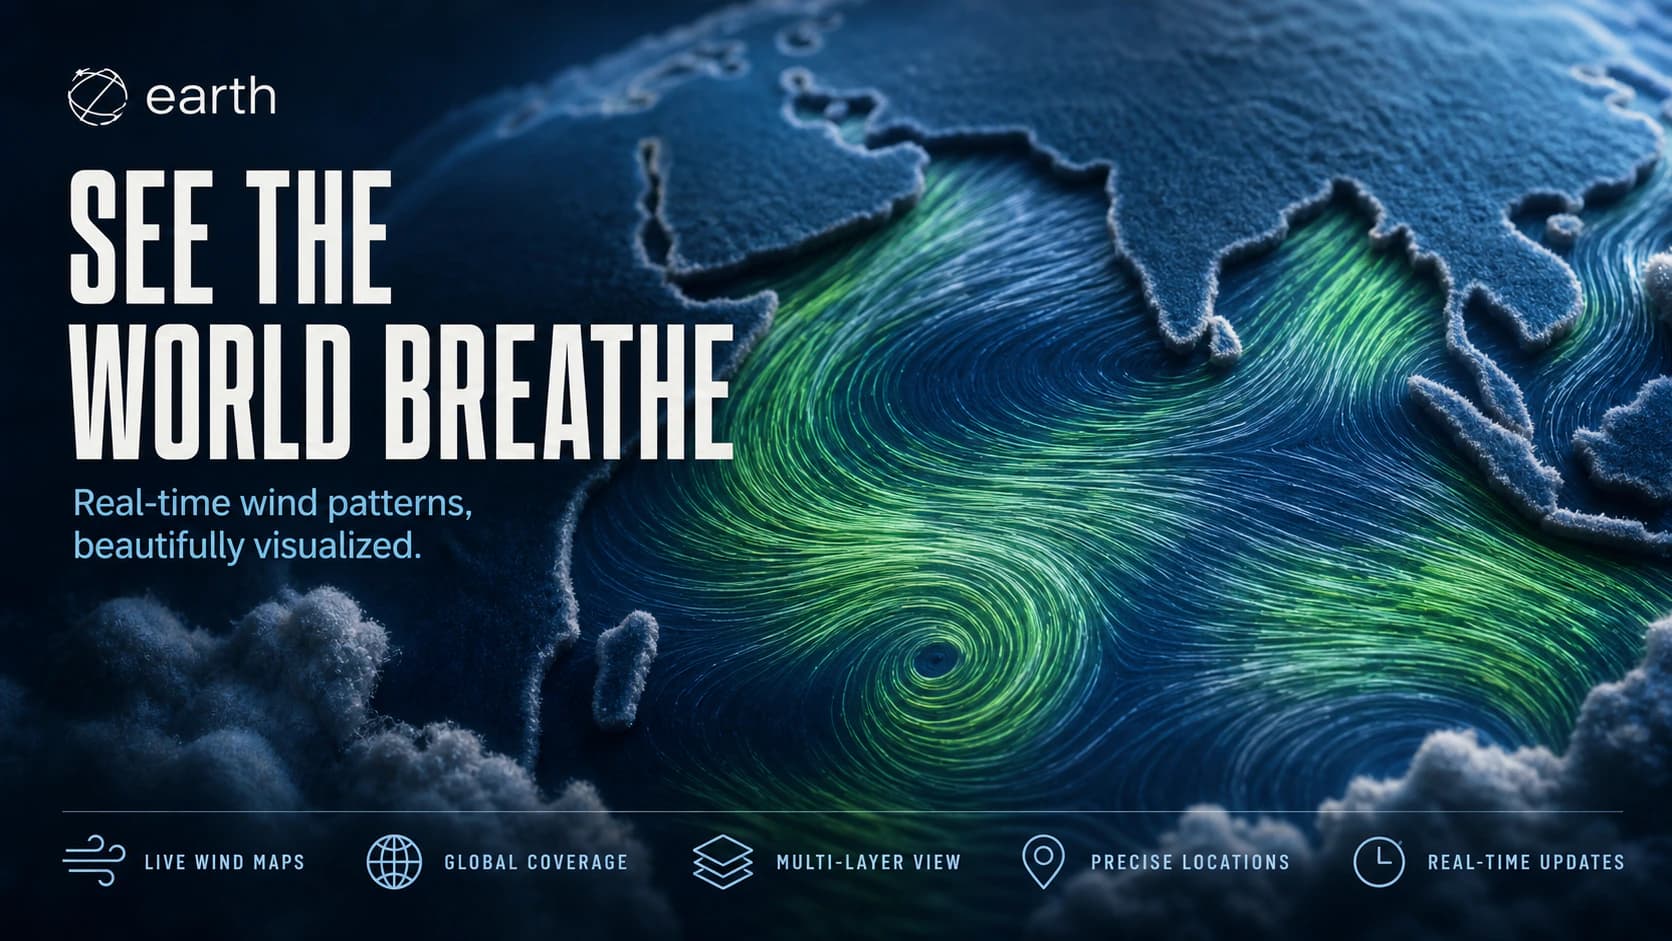
earth.nullschool.net is an interactive globe that visualizes global weather, ocean, and atmospheric data as a moving field of particles. Wind direction and speed appear as flowing currents across the planet, turning an abstract forecast model into something that can be read almost physically. The interface can switch between altitude levels, projections, dates, and overlays for temperature, pressure, precipitation, ocean currents, waves, and surface anomalies. Additional layers expose aerosols and pollutants including smoke, dust, carbon monoxide, nitrogen dioxide, and several sizes of particulate matter.
The moving particles do real explanatory work. They show the curl of a cyclone, the reach of wildfire smoke, or the lazy bend of an ocean current before any number is opened. Forecast and observation systems feed the layers on different schedules. The compact menu, scientific abbreviations, and almost complete absence of hand-holding make the first visit slightly stern. This is also a visualization, not the place to check whether the local school is closing. Learn the controls and the planet stops looking like a collection of weather icons. It starts breathing.
Using earth
Start with the wind map
Open the earth menu and choose Air mode. Sfc shows surface conditions; the pressure levels show conditions at different atmospheric heights. Wind is the wind-speed overlay, while Temp switches the colors to temperature. Check the selected height when comparing places, because surface and upper-air conditions are different views.
Change the time or layer
Use Choose Date to select a date, or Now to return to the most recent data. Ocean mode offers currents, waves, and sea-surface temperature. The menu identifies the displayed data and its source, so read those alongside the timestamp and color scale.
Understand what is being shown
This is a model-based visualization, not a live camera view. Weather forecasts update every three hours, while other datasets have different schedules. Nullschool does not guarantee the accuracy of its weather and ocean data.
Shared by
Spotted and shared by a Biltib member“earth.nullschool.net is a data interface with the confidence to look like art. Those flowing particles are not decoration: switch layers and they reveal wind, ocean currents, waves, smoke, dust, or PM2.5 from real forecast systems. I love clicking into a storm and seeing the numbers underneath the spectacle. A few controls are hidden behind terse labels, but once you learn the map, weather stops being an icon and becomes a moving system.”