Reactor Atlas
Explore nuclear power through the places, records, and history behind it.
Save to collection
Choose a home for Reactor Atlas.
Start your first collection below.
Why it’s worth your time
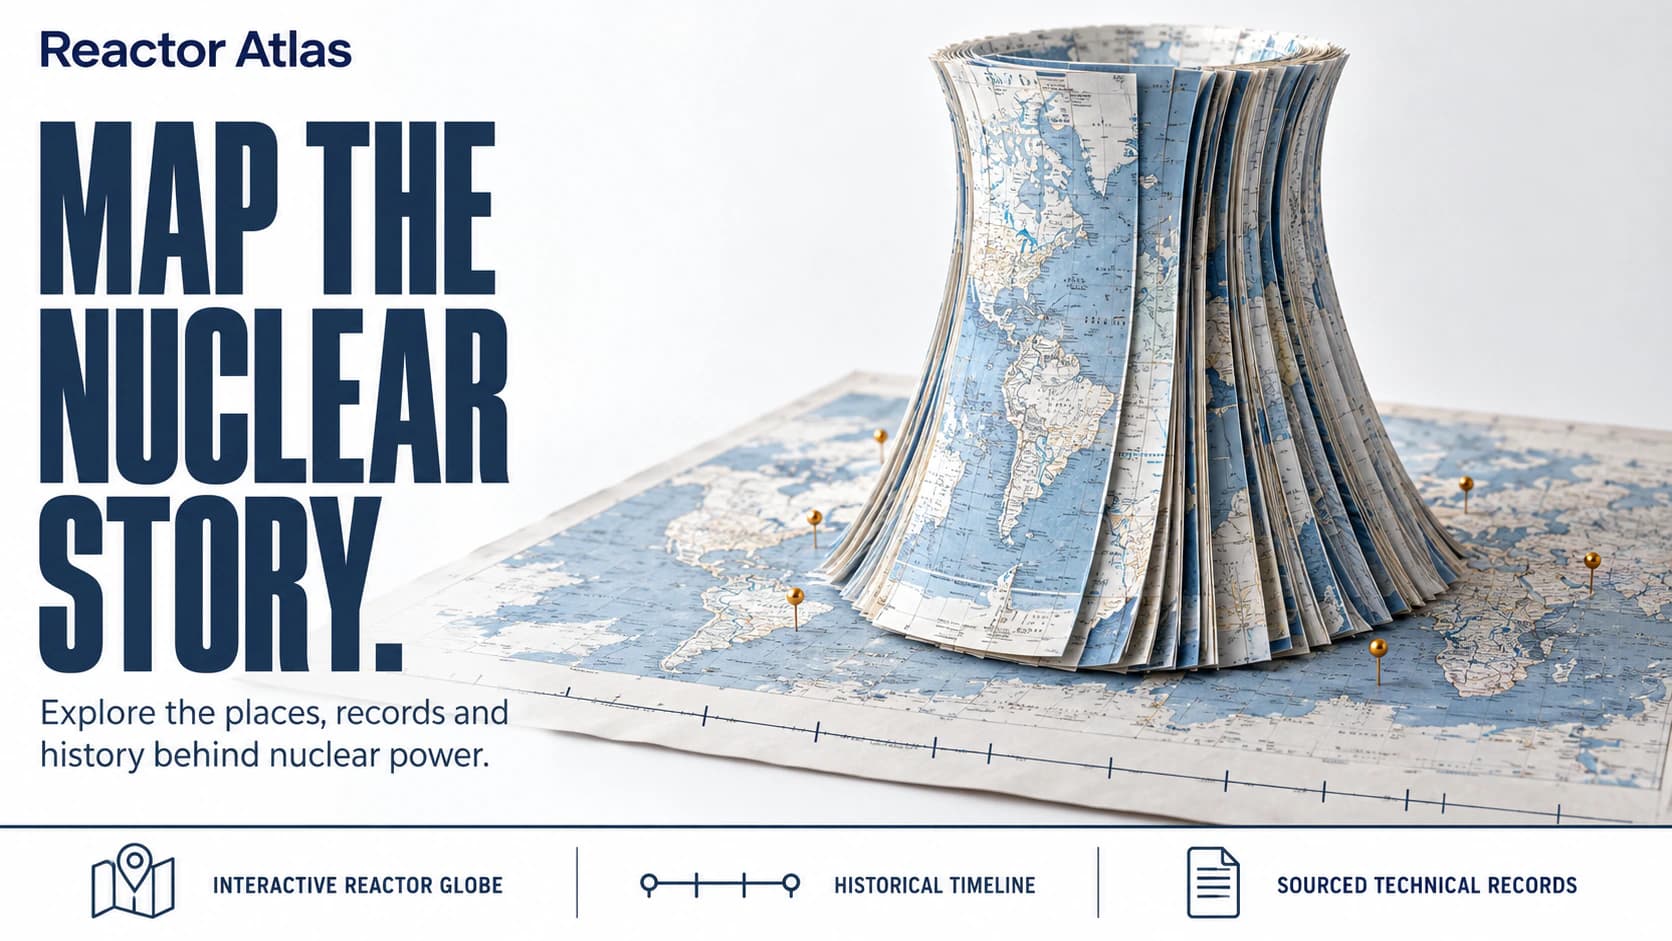
Reactor Atlas brings nuclear reactor information into an interactive globe with a historical timeline and technical records. Built by nuclear engineer Federico Caccia, it combines sources including IAEA PRIS, Global Energy Monitor, and Wikidata. Visitors can explore facilities geographically and follow the development of nuclear power over time.
The project also includes an educational wiki about reactor designs and a monitoring section that draws on public operational feeds. Its methodology explains how it handles changing facility names, different milestones, measurement definitions, and disagreements between sources. References preserve a path back to the original material. That context makes the atlas useful for exploring how individual facilities fit into a much larger industry.
Using Reactor Atlas
Access and availability
Browser-based. The creator describes the atlas as free, bilingual, and accessible without signup. Monitoring coverage and freshness depend on the underlying feeds.
Shared by
Spotted and shared by a Biltib member“The globe offers an inviting starting point, while the connected records give the project depth. Its emphasis on dates, definitions, and original sources makes the information behind the map a substantial part of the experience.”
Community notes
Keep discovering
Explore more →More from Biltib